Alpha & p-values
p-values
Whereas effect sizes tell us about practical significance, they do not tell us about statistical significance. That is what p-values are for: they tell us whether our results are statistically significant or how surprising they are. The formal definition of a p-value is that it is the probability of observing data that is as extreme or more extreme than the data you have observed, assuming the null hypothesis is true. There’s two things to keep in mind about this definition:
- The p-value is about the probability of our data. It is not about the probability of our hypothesis.
- The p-value is based on the assumption that the null hypothesis is true. In null hypothesis significance testing, we are only ever testing against the null. We can never “accept” the alternative hypothesis but rather reject the null. If we reject the null enough times (and rarely fail to reject the null) then it gives weighted evidence towards our alternative hypothesis, but we can never prove the alternative hypothesis is true.
In APA style, we report the exact p-values rounded to three decimal places. In your jamovi settings, you can set the statistical significant reporting to “3dp” to satisfy APA requirements.
Another way we could think of the p-value is: assuming there is no difference (i.e., the null hypothesis is true), how surprising is our data?
Courtesy of Dr. Jess Hartnett (@Notawful on Twitter)
You may have heard of p-values before, including some bad things (read the end of this chapter for more info). You may then be wondering why we are learning about p-values if they seem so problematic that they should be banned.
The biggest problem with p-values is that they are misunderstood, even by researchers. They are often misinterpreted. Daniel Lakens has a great blog post on the topic and a great MOOC about improving your statistical inferences. He also has a great article that “The Practical Alternative to the p Value Is the Correctly Used p Value.).” For graduate students, one of your assignments is from that MOOC called “Understanding common misconceptions about p-values.”
What are common misconceptions about p-values?
For graduate students, one of your assignments is from that MOOC called “Understanding common misconceptions about p-values” that comes from Daniel Lakens. However, this section will summarize those misconceptions.
Misunderstanding 1: A non-significant p-value means that the null hypothesis is true. A common version of this misconception is reading a sentence such as ‘because p > 0.05 we can conclude that there is no effect’. Another version of such a sentence is ‘there was no difference, (p > 0.05)’.
Misunderstanding 2: A significant p-value means that the null hypothesis is false. (Lakens, 2017)
These are both misconceptions because the p-values only tell us about the probability of our data, not the null or alternative hypothesis. We never know whether the null or alternative hypothesis is true, and we could always be making a Type 1 or Type 2 error depending on whether our results are statistically significant or not.
Misunderstanding 3: A significant p-value means that a practically important effect has been discovered. (Lakens, 2017)
p-values tell us about statistical significance; only effect sizes can tell us anything about whether the effect is practically important.
Misunderstanding 4:If you have observed a significant finding, the probability that you have made a Type 1 error (a false positive) is 5%. (Lakens, 2017)
Our p-values tell us nothing about the probability of a Type 1 error or Type 2 error. If we set our Type 1 error rate (alpha) to 5%, and if the null hypothesis is true (which, again, we technically will never know for real), then every 1 in 20 (5%) studies examining this effect will be statistically significant and will be a Type 1 error. Note that it’s about the rate of errors across studies and it’s something we set ahead of time. The p-values, again, are about the probability of our data!
Are p-values bad?
Some have argued that we should abandon the p-value; this has led to things like journals completely banning p-values altogether like Basic and Applied Social Psychology. However, I agree with Lakens that “the practical alternative to the p-value is the correctly used p-value.” That’s to say: there is nothing wrong with the p-value inherently, and it can be useful. Rather, what’s wrong is that many people use them incorrectly.
The journal Basic and Applied Social Psychology banned the use of p-values, claiming that NHST is invalid. Instead, they want researchers to focus on effect sizes and appropriate power analyses. Although these are laudable attempts–I agree that researchers should have highly powered studies and focus more on practical significance over statistical significance–I agree more with researchers like Daniel Lakens who point out that the problem is researchers want NHST to do what it does not do. They want statistical procedures that can confirm a hypothesis, which NHST cannot do. While larger samples and a focus on effect sizes can help, we should trust NHST to do what it can do: which is tell us about the probabily of the surprisingness of our data if the null hypothesis is true. Read more about the journal’s statement here: https://www.tandfonline.com/doi/full/10.1080/01973533.2015.1012991
Alpha
The p-value is the probability of the “surprisingness” of your data. But what is considered surprising enough? That’s where alpha comes in, which determines our critical region of significance. The figure below should look familiar; the area in red is the critical value, otherwise known at alpha, which is set by the researcher to determine what is considered surprising.
The alpha level is the level at which we consider the data so surprising that we reject the null hypothesis. Everything in the red region is our alpha and signifies the region of statistical significance. Therefore, whether a p-value is statistically significant depends on what our alpha is set at.
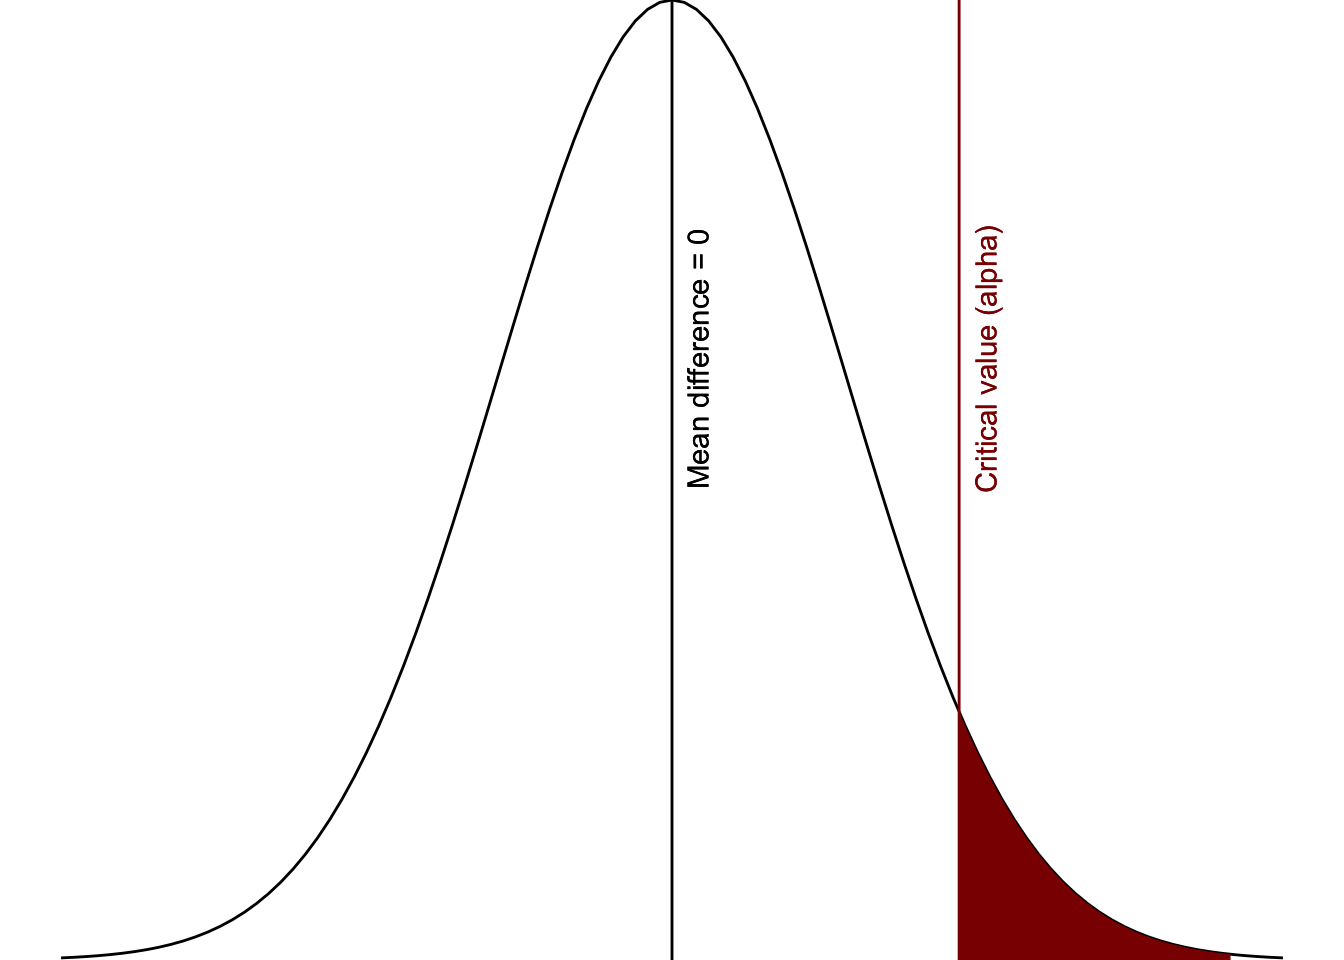
Figure 1: Critical area of statistical significance
Why is alpha usually set at 5%? It comes from Fisher (1925), who said something that eventually grew to tradition:
A deviation exceeding the standard deviation occurs about once in three trials. Twice the standard deviation is exceeded only about once in 22 trials, thrice the standard deviation only once in 370 trials…. The value for which P = .05, or 1 in 20, is 1.96 or nearly 2 ; it is convenient to take this point as a limit in judging whether a deviation is to be considered significant or not. Deviations exceeding twice the standard deviation are thus formally regarded as significant.
Basically, .05 was convenient. It was 1/20. It was around 2 standard deviations from the mean in a normal distribution. For some reason, it caught on (maybe the “formally regarded as significant” was why).
However, a year later, even Fisher acknowledged we shouldn’t just arbitrarily use p = .05 as our alpha level.1 Rather, we should consider setting it at higher odds (e.g., p = .01). He also argued, “A scientific fact should be regarded as experimentally established only if a properly designed experiment rarely fails to give this level of significance.” (Fisher, 1926, p. 504).
In other words, we need to think critically about the alpha level we set and we need to test an effect multiple times before we start thinking the alternative hypothesis is true. We’ll discuss power next before we start putting it all together.
What value do I set alpha at?
In this course, unless I specify otherwise, we will use an alpha of .05.
However, in reality, how do you choose your alpha level? There’s a bit more to it than we’re going to cover in this course, but it has to do with both your alpha and power level (and we haven’t covered power yet), and the probability that the null or alternative hypothesis is true (which we can never truly know). This is not completely accurate, but generally speaking if you are more concerned with a false positive (type 1 error) then lower your alpha and if you are concerned with a false negative (type 2 error) then increase your power.
What does this look like in practice? In a Psi Chi article by Kobza and Salter (2016), they stated, “Due to the high number of statistical tests conducted, a lower p value (.01) was used to determine significance.” (p. 75). If you find more examples of researchers changing their alpha values, please send them to me so I can add them here!
How do I know what alpha researchers are using?
Ideally, all researchers should be reporting their alpha values in all their publications. For example, in a Psi Chi article by Campero-Oliart and colleagues (2020), they stated, “Alpha levels for all analyses were set to .05.” (p. 47).
In reality, we typically don’t report anything and assume a default of .05 without explicitly stating so (and yes, I am also guilty of this). However, you should always be thinking critically of your alpha value and, if you are using something other than .05, you should explain what level you choose and why.
Video
The following video walks through some of the effect sizes, alpha, and power stuff.
You might also like this video by Daniel Lakens and how he defines the p-value.
If you’d like to read a more in-depth discussion of p-values, I recommend also reading Daniel Lakens’ chapter in his textbook “Improving Your Statistical Inferences.”
Another video recommended by a student is this one from zedstatistics.
If you want to read more, this is a short read on the history of the .05 alpha level: https://www2.psych.ubc.ca/~schaller/528Readings/CowlesDavis1982.pdf↩︎