22. General Linear Model
The regression is a General Linear Model (GLM). Everything we’ve learned up to this point is also a general linear model. Pretty much everything we’ve learned in this class could be performed as simple a regression. You may wonder why we have not just taught regression and none of the others. There are some who are indeed proponents of that! However, I believe teaching “simpler” statistics like the t-test and correlation first is easiest to understand. Most of the statistics you will perform from here on out—including in your careers—will be what we have already learned (i.e., t-test, ANOVA, chi-square, correlation). However, I present this information so you may begin to see how all of this is related.
If you’d like to learn more about this, there’s a fantastic online book on the subject called Common statistical tests are linear models (or: how to teach stats)
Note that for all these examples I am using the Sample_Dataset_2014.sav dataset and I am only presenting the relevant output. I am also only going to cover the correlation, t-tests, and one-way ANOVA because they are the simplest to compare. You can run these yourself! You can find the dataset here: Sample_Dataset_2014.xlsx Download
Correlation as a regression
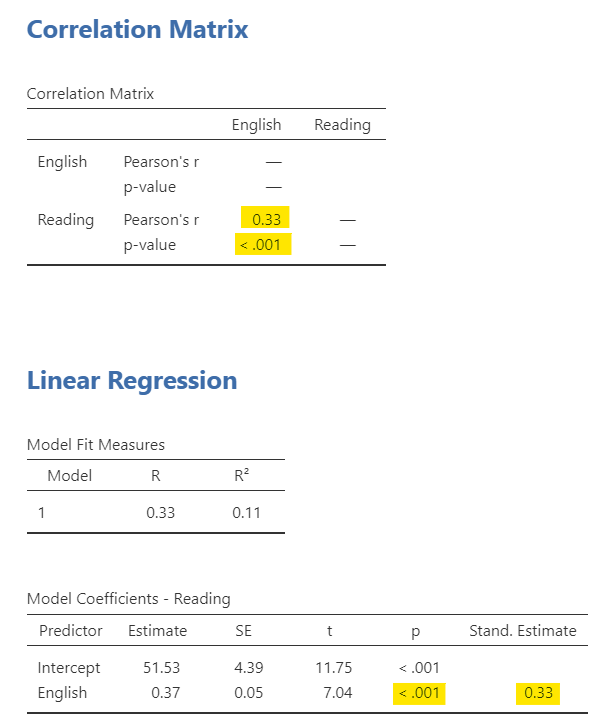
Imagine we want to see how English and Reading are related. We would do a Pearson correlation, as seen on the top. However, we could also run a simple regression with English predicting Reading or vice versa, as seen on the bottom.
Notice how the Beta coefficient in the regression output is the standardized coefficient and that the correlation is the standardized covariance. Therefore, their values (and p-values) match identically!
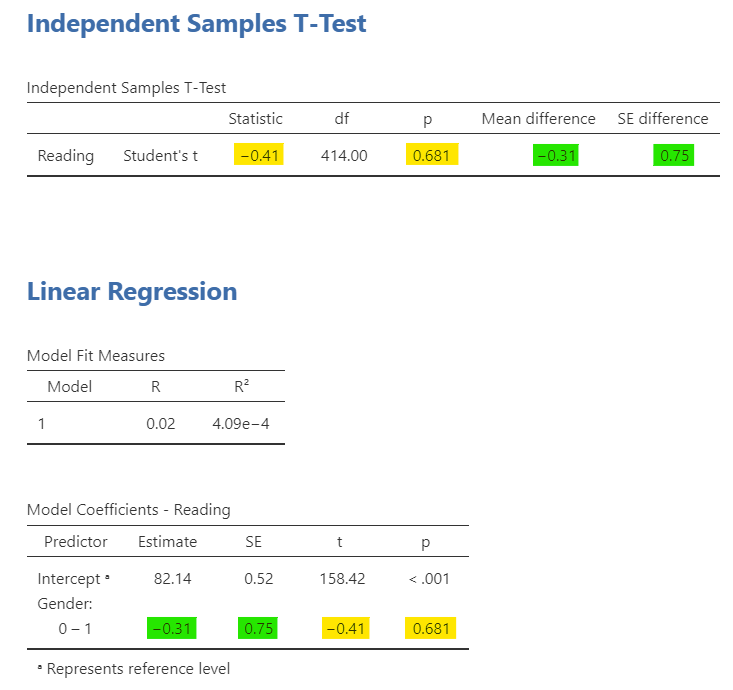
Independent t-test as a regression
Next let’s look at how gender is related to reading scores. First, our t-statistic and p-value match directly from the independent t-test to the linear regression coefficient. Second, our unstandardized estimate in the regression is exactly the mean difference between the two genders!
Dependent t-test as a regression
The dependent t-test can’t be performed as a regression in the base jamovi, but it can if we run it in the Rj editor using the stats package (as opposed to using the jamovi package that we’ve been using as part of the jamovi software). The regression formula for a dependent t-test is \(y_1 -y_0 = 1\) and jamovi doesn’t like it if there are not IVs, just an intercept. However, the stats package doesn’t mind! Notice that our t-statistic, df, and p-value are exactly the same, and that the intercept estimate and SE match the mean difference in the paired samples t-test.

One-way ANOVA as a regression
The one-way ANOVA is the same as regression, too. Let’s examine how rank (an ordinal variable from 1-4) relates to English scores. In the linear regression, we asked for the ANOVA test under Model Coefficients; notice how it directly matches the ANOVA table.
Although I did not directly ask for them, the estimated marginal means for the linear regression match that of the one-way ANOVA. However, I want to call attention to how the coefficients directly match. The intercept is the average English score when Rank = 1 (freshman). However, the estimate for 2 – 1 is .68, but 81.93 + .68 = 82.61; it’s not exact due to rounding errors, but it matches the mean for group 2 because in the linear equation if you set that value to 1 you are saying the other values are 0 so the group membership is Rank = 2 (sophomore). You can do this for all the groups and see how they match.
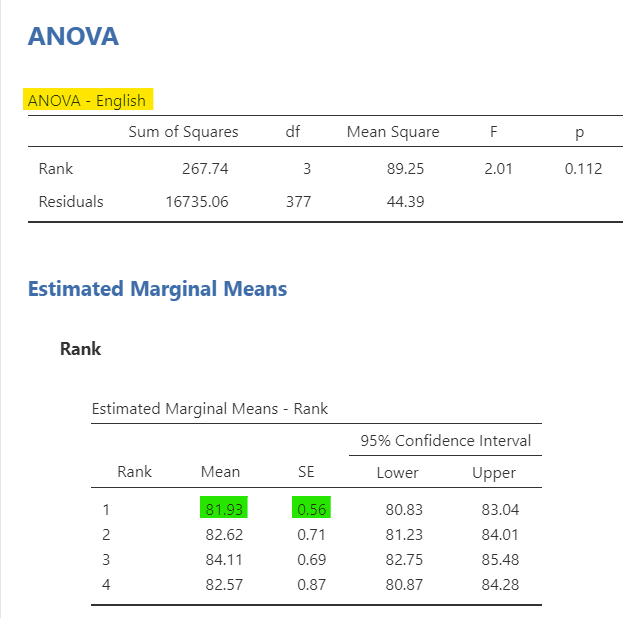
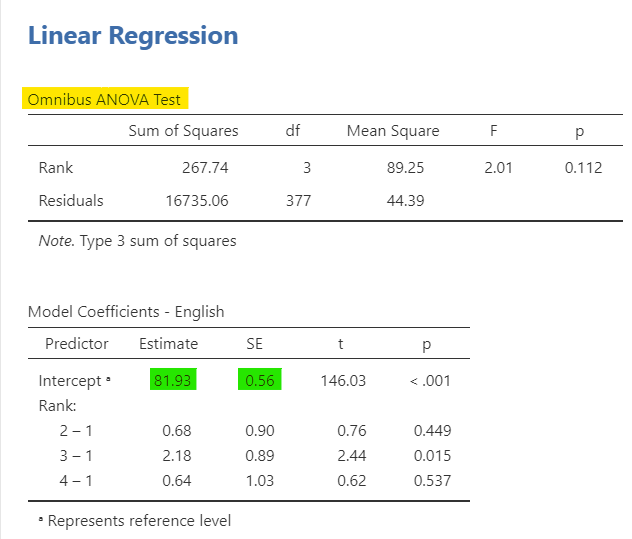
Figure 1: One-way ANOVA as a regression